Competing Risks SurPyval Modelling
This page shows how to use SurPyval’s competing risks classes. For the theoretical background see Competing Risks Analysis.
Note
Every example on this page is executed when the documentation is built, so the outputs shown are produced by the installed version of surpyval.
Standard imports used throughout this page:
import surpyval as surv
import numpy as np
from matplotlib import pyplot as plt
Fitting a Competing Risks Model
The CompetingRisks class estimates a non-parametric cumulative incidence
function (CIF) for each failure cause, using the Nelson-Aalen or
Kaplan-Meier estimate of the overall survival function. Pass the observed
times, a cause indicator, and optional censoring flags:
from surpyval.univariate.competing_risks import CompetingRisks
from surpyval import Weibull, Exponential

# Simulated data: two competing causes
np.random.seed(42)
t1 = Weibull.random(100, 50, 2.5)   # cause 1 latent times
t2 = Exponential.random(100, 1./80)             # cause 2 latent times

# Observed time is the minimum; cause is which latent time was smaller
x = np.minimum(t1, t2)
cause = (t2 < t1).astype(int)  # 0 = cause 1, 1 = cause 2
c = np.zeros_like(x, dtype=int)  # all observed (no censoring)

model = CompetingRisks.fit(
    x=x,
    c=c,
    e=cause,
)
print(model)
Competing Risk model with events:
[0, 1]
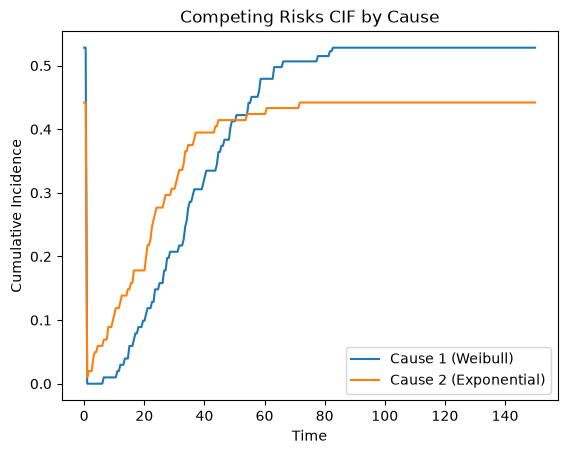
Once fitted, you can query the CIF for each cause:
t_plot = np.linspace(0, 150, 300)
for k, label in enumerate(['Cause 1 (Weibull)', 'Cause 2 (Exponential)']):
    plt.plot(t_plot, model.cif(t_plot, event=k), label=label)
plt.xlabel('Time')
plt.ylabel('Cumulative Incidence')
plt.legend()
plt.title('Competing Risks CIF by Cause')
Text(0.5, 1.0, 'Competing Risks CIF by Cause')
Comparing incidence across groups: Gray’s test
Having estimated a cumulative incidence function for each group,
surpyval.gray_test tests whether the CIFs differ for a chosen cause. It is
the
competing-risks analogue of the log-rank test, but with an important
distinction: where a cause-specific log-rank compares the instantaneous
hazards of a cause, Gray’s test compares the incidence — the CIFs directly.
It does this by keeping competing-cause failures in the subdistribution risk
set with an inverse-probability-of-censoring weight, rather than removing them.
Reach for it when the clinical or engineering question is “how many fail of this
cause”, not “how fast”.
Pass the observed times x, the per-observation cause label e, the group
label, and the cause of interest (use c for censored rows). Here two
groups have genuinely different cause-1 incidence:
from surpyval import gray_test

rng = np.random.default_rng(7)

def simulate(n, p_cause1):
    is1 = rng.random(n) < p_cause1
    t = rng.exponential(6.0, n)
    return t, np.where(is1, 1, 2)         # causes labelled 1 and 2

x_a, e_a = simulate(300, 0.35)
x_b, e_b = simulate(300, 0.60)            # higher cause-1 incidence
x = np.concatenate([x_a, x_b])
e = np.concatenate([e_a, e_b])
group = np.array([0] * 300 + [1] * 300)

result = gray_test(x, e, group, cause=1)
print('statistic = %.2f   df = %d   p = %.3g'
      % (result.statistic, result.df, result.p_value))
statistic = 48.86 df = 1 p = 2.75e-12
The tiny p-value correctly flags the difference in cause-1 incidence. On
data where the two groups share the same incidence the test is calibrated,
returning p-values spread over [0, 1] — including under heavy censoring,
which is where the inverse-probability weighting earns its keep.
Fine-Gray Sub-distribution Hazards
The Fine-Gray model estimates the effect of covariates directly on the
cumulative incidence function of a chosen cause, using an
inverse-probability-of-censoring-weighted subdistribution risk set. e is
the per-observation cause label (None for a censored row) and cause
selects the cause of interest.
Here we simulate two-cause data whose cause-1 incidence follows a Fine-Gray model with coefficients \((0.7, -0.4)\), apply right-censoring, and recover the coefficients:
from surpyval.univariate.competing_risks import FineGray

rng = np.random.default_rng(1)
N, beta, p = 800, np.array([0.7, -0.4]), 0.5
Z = rng.uniform(-1, 1, size=(N, 2))
phi = np.exp(Z @ beta)
p1 = 1 - (1 - p) ** phi                    # P(cause = 1 | Z)
is1 = rng.uniform(size=N) < p1

x = np.empty(N)
e = np.empty(N, dtype=object)
v = rng.uniform(size=N)
w = 1 - (1 - v * p1) ** (1 / phi)          # invert the cause-1 CIF
x[is1] = (-np.log(np.clip(1 - w / p, 1e-12, 1.0)))[is1]
e[is1] = 1
x[~is1] = rng.exponential(1.0, size=N)[~is1]   # cause 2 mops up the rest
e[~is1] = 2

cens = rng.exponential(3.0, size=N)        # independent right-censoring
c = (x > cens).astype(int)
x = np.minimum(x, cens)
e[c == 1] = None

model = FineGray.fit(x, Z, e, c=c, cause=1)
model
Fine-Gray Subdistribution Hazard Model
======================================
Cause of interest   : 1
Coefficients (beta'Z acts on the subdistribution hazard):
   beta_0  :   0.770136  (se 0.104097, p 0.0000)
   beta_1  :  -0.416207  (se 0.096274, p 0.0000)
The IPCW correction is what lets the coefficients come back near their true
values under censoring — a naive unweighted subdistribution risk set would be
biased. Because the model targets the incidence directly, cif reads off the
cumulative incidence of the cause at any covariate value:
t = np.linspace(0, 3, 200)
for z1, label in [(-1.0, 'Z1 = -1'), (1.0, 'Z1 = +1')]:
    plt.plot(t, model.cif(t, Z=[z1, 0.0]), label=label)
plt.legend()
plt.xlabel('Time')
plt.ylabel('Cumulative incidence of cause 1')
Text(0, 0.5, 'Cumulative incidence of cause 1')
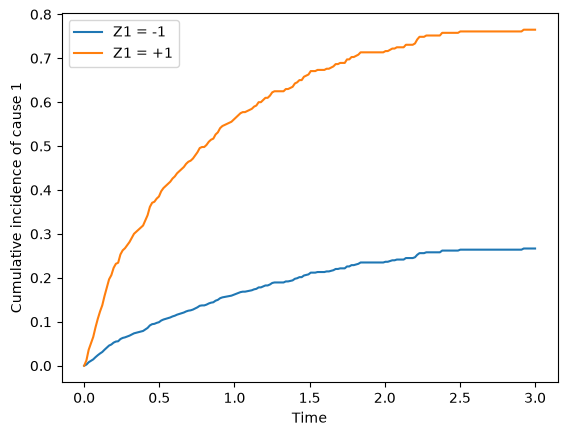
A positive \(\beta_0\) raises the cause-1 incidence, so the Z1 = +1
curve sits above Z1 = -1.
Cause-Specific Proportional Hazards
CompetingRisksProportionalHazards fits a proportional-hazards model per
cause. With how="Cox" (the default) each cause is a Cox model with the
other causes treated as censored; how="Fine-Gray" fits the subdistribution
model above for every cause. It reuses the simulated data from the previous
section:
from surpyval.univariate.competing_risks import (
    CompetingRisksProportionalHazards,
)

csph = CompetingRisksProportionalHazards.fit(x, Z, e, c=c, how="Cox")
# cumulative incidence of cause 1 at a covariate vector
csph.cif(np.array([0.5, 1.0, 2.0]), Z=[0.5, -0.5], event=1)
array([0.32634361, 0.49461867, 0.65304082])
The cause-specific model answers “what drives the rate of this cause among those still at risk”, while Fine-Gray answers “what drives the eventual incidence of this cause”; the two coincide only when the competing causes are unaffected by the covariates.