Conventions
Variable Names
Before discussing the formats, the conventions for vairable names needs to be clarified. These conventions are:
- x = The random variable (time, stress etc.) array
- xl = The random variable (time, stress etc.) array for the left interval of interval censored data.
- xr = The random variable (time, stress etc.) array for the right interval of interval censored data.
- c = Refers to the censoring data array associated with x
- n = The count array associated with x
- t = the truncation values for the left and right truncation at x (must be two dim, or use tl and tr instead)
- r = risk set at x
- d = failures/deaths at x
- t = two dimensional array of the truncation interval at x
- tl = one dimensional array of the value at which x is left truncated
- tr = one dimensional array of the value at which x is right truncated
Data Formats
The conventional formats use in surpyval are:
- xcnt = x variables, with c as the censoring scheme, n as the counts, and t as the truncation
- xrd = x variables, with the risk set, r, at x and the deaths, d, also at x
All functions in surpyval have default handling conditions for c and n. That is, if these variables aren’t passed, it is assumed that there was one observation and it was a failure for every x.
Surpyval fit() functions use the xcnt format. But the package has handlers for other formats to rearrange it to the needed format. Other formats are:
wranglers for formats:
- fs = failure time array, f, and right censored time array, s
- fsl = fs format plus an array for left censored times.
Censoring conventions
For the censoring values, surpyval uses the convention used in Meeker and Escobar, that is:
- -1 = left
- 0 = failure / event
- 1 = right
- 2 = interval censoring. Must have left and right value in x
This convention gives an intuitive feel for the placement of the data on a timeline.
Function conventions
There exists a relationship between each of the functions of a distribution and the others. This can be very useful to keep in mind when understanding how surpyval works. For example, the Nelson-Aalen estimator is used to estimate the cumulative hazard function (Hf), the below relationships is how distribution for this can be used to estimate the survival function, or the cdf.
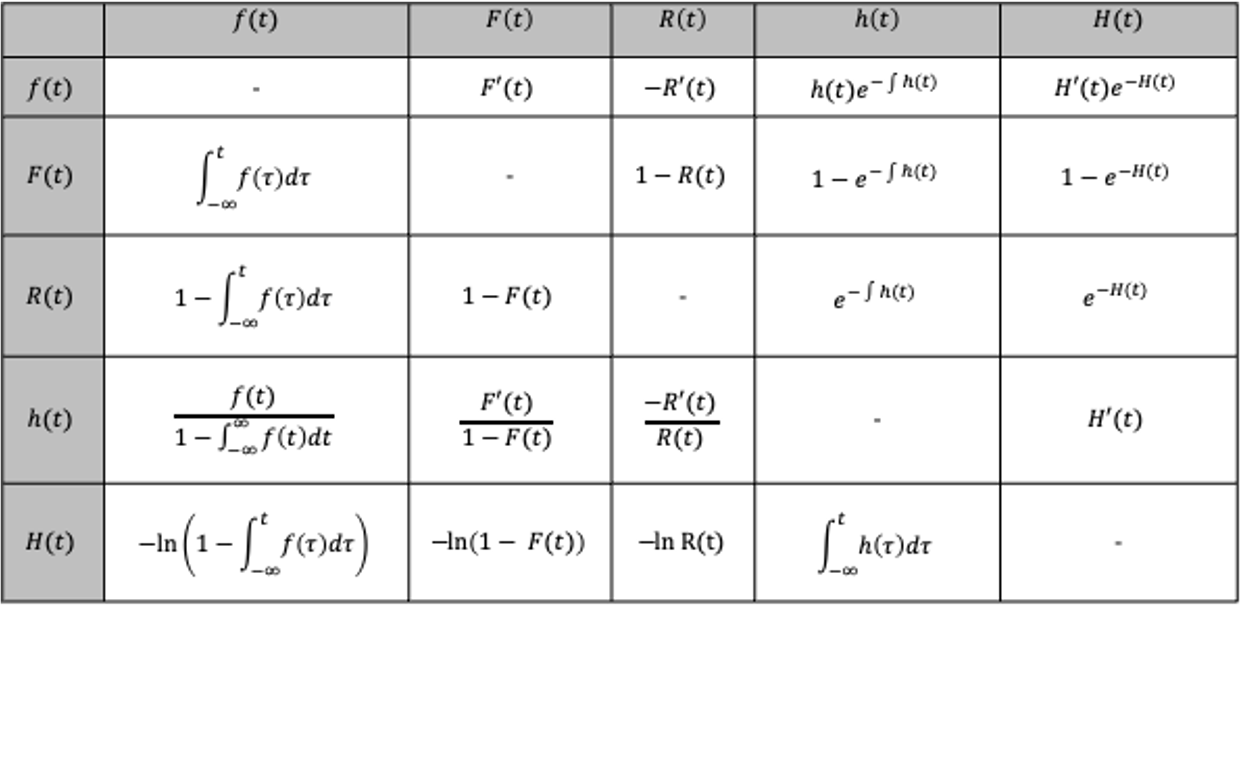
The above table shows how the function on the right, can be described by the function along the top row (I leave out the function describing itself as it is simply itself…). So, an interesting one is that the reliability or survival function, R(t), is simply the exponentiated negative of the cumulative hazard function! This relationship holds for every distribution.
The conventions for SurPyval are that each object returned from a fit() call has the ability to compute the following:
df()- The density functionff()- The CDFsf()- The survival function, or reliability functionhf()- The (instantaneous) hazard functionHf()- The cumulative hazard function
These functions can be used to plot or even in optimisers so that you can optimize decisions that you are guiding with your survival analysis.